
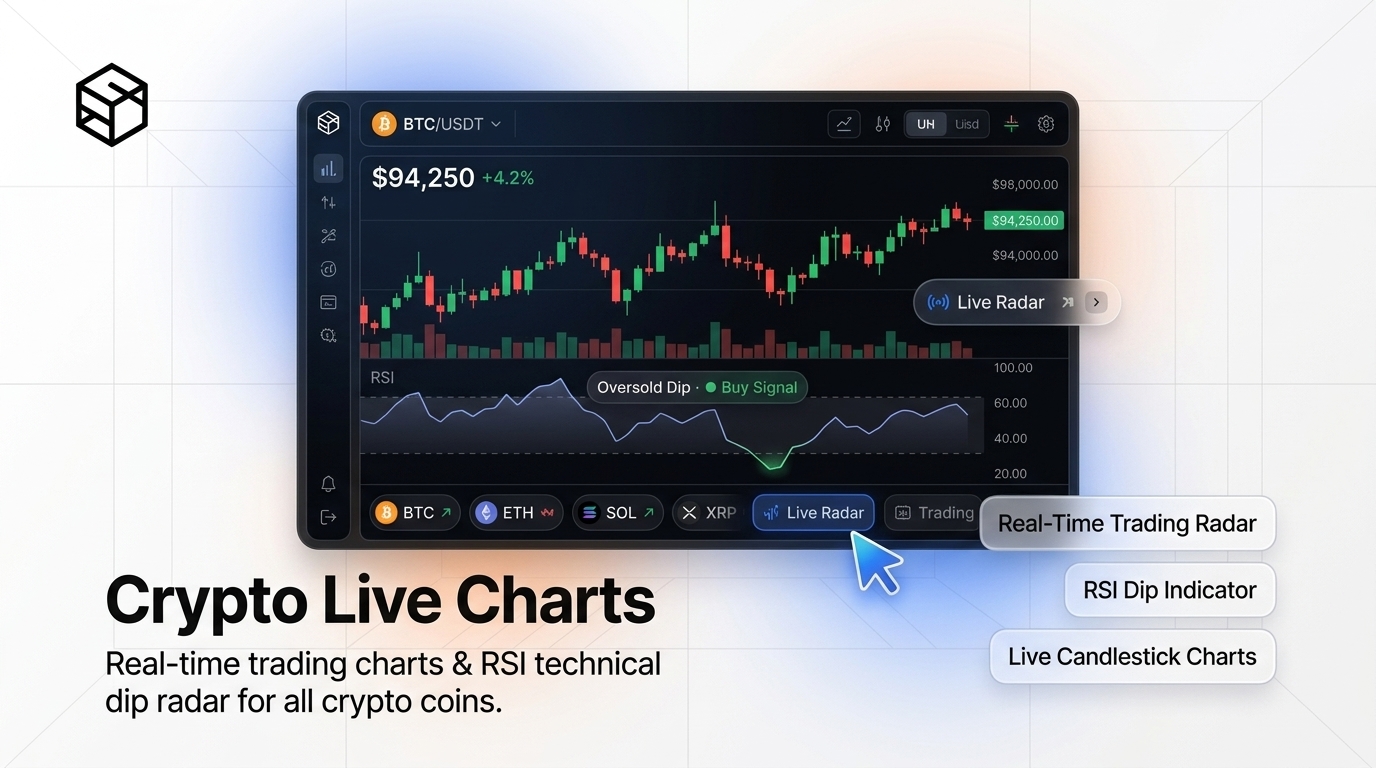
ShiftTools is an independent technology utility and is not a registered investment advisor, research analyst, broker, or financial intermediary under SEBI (India), the US SEC/CFTC, UK FCA, or any other financial regulatory authority. Candlestick charts, market pricing, and technical indicators (such as 14-period RSI) are provided strictly for informational and educational purposes. Digital assets are highly volatile and speculative. Always conduct independent research or consult a licensed professional before making financial decisions.
In the 24/7 hyper-volatile cryptocurrency markets, navigating Bitcoin's violent price swings requires disciplined, quantitative decision-making. Traders who rely on gut feelings, social media hype, or lagging emotional reactions invariably buy at local market cycle peaks and panic-sell at catastrophic liquidation bottoms.
Among all technical momentum indicators developed in modern financial mathematics, the Relative Strength Index (RSI), conceived by American mechanical engineer and technical analyst J. Welles Wilder Jr. in 1978, remains the cornerstone of quantitative crypto charting.
However, applying classic equity RSI rules directly to Bitcoin without modification is a recipe for liquidation. Traditional stock market textbooks teach that an asset with an RSI above 70 is automatically "overbought" and must be shorted, while an RSI below 30 is "oversold" and must be bought. In crypto, Bitcoin can remain pinned in an extreme 80+ RSI parabolic regime for weeks during a bull market expansion, destroying premature short sellers.
In this quantitative trading guide, we dissect the mathematical smoothing formulas behind the 14-period RSI, explain the mechanics of Regular and Hidden Divergences, teach multi-timeframe confluence strategies, and demonstrate how to track real-time Bitcoin momentum with zero account sign-up using the ShiftTools Live Crypto Chart.
Looking for an instant, private Crypto Chart?
Process, inspect, and export your files 100% locally in your browser memory with zero server uploads.
1. The Mathematics of Wilder's RSI
The Relative Strength Index is a bounded momentum oscillator operating on a scale between 0 and 100. It measures the ratio of upward price changes to downward price changes over a specified lookback window (the standard default is $N = 14\text{ periods}$).
The formula begins by calculating Relative Strength (RS):
The indicator then normalizes RS into an index bounded between 0 and 100:
Crucially, Wilder did not use a simple arithmetic moving average. Instead, he pioneered Wilder's Smoothing (Modified Exponential Smoothing), where today's average gain is calculated as:
Smoothed_Avg_Gain = [(Prior_Avg_Gain * 13) + Current_Gain] / 14
Smoothed_Avg_Loss = [(Prior_Avg_Loss * 13) + Current_Loss] / 14
This mathematical structure gives the RSI its signature responsiveness: it reacts quickly to explosive trend shifts while retaining memory of historical price action to prevent excessive false whipsaws.
2. The Myth of the 70/30 Rule in Bitcoin Markets
Novice traders often treat the horizontal 70 and 30 threshold lines as automatic trade triggers. In Bitcoin trading, this is a catastrophic mistake.
A. The Bull Market Regime (Range Shift 40 to 90)
During a verified Bitcoin bull cycle, persistent spot ETF inflows and structural accumulation push price into strong momentum regimes. The 50 line acts as psychological support. When Bitcoin dips during a bull market, the 4-hour or Daily RSI rarely breaches below 40. Selling simply because the RSI touched 72 often cuts winning long trades prematurely before a 40% leg upward.
B. The Bear Market Regime (Range Shift 15 to 60)
Conversely, in prolonged macro bear trends, institutional distribution and cascading leverage liquidations overpower dip-buyers. The 50-60 zone acts as stiff resistance. Bitcoin can drop into deeply oversold territory (RSI 20) and stay there for weeks while price continues bleeding lower.
3. Mastering RSI Divergences: The Highest Probability Signal
The single most reliable predictive signal generated by the Relative Strength Index is Divergence: a structural disagreement between price action and momentum.
| Divergence Type | Price Action | RSI Indicator Action | Implication & Action |
|---|---|---|---|
| Regular Bullish Divergence | Forms a Lower Low (LL) | Forms a Higher Low (HL) | Seller Exhaustion → Reversal Upward |
| Hidden Bullish Divergence | Forms a Higher Low (HL) | Forms a Lower Low (LL) | Bull Trend Continuation → Buy Dip |
| Regular Bearish Divergence | Forms a Higher High (HH) | Forms a Lower High (LH) | Buyer Exhaustion → Reversal Downward |
| Hidden Bearish Divergence | Forms a Lower High (LH) | Forms a Higher High (HH) | Bear Trend Continuation → Short Rally |
In strong bull trends, Hidden Bullish Divergence occurs when price makes a higher low (showing underlying buyer strength), while the RSI plunges to a lower low. This indicates that momentum was aggressively reset and sellers exhausted their ammunition without successfully depressing price. It is one of the highest win-rate entry triggers in cryptocurrency trading.
4. Multi-Timeframe Confluence & Risk Management
A 5-minute RSI divergence can be invalidated in seconds by a single 200 BTC market sell order. Professional quantitative analysts practice Multi-Timeframe Analysis (MTF) to filter out intraday noise:
- Daily Chart (1D): Determine Macro Bias. Is the Daily RSI above or below 50? If the Daily RSI is at 65 above the 200-day moving average, the macro bias is aggressively bullish. Only look for long setups.
- 4-Hour Chart (4H): Identify Structural Swings. Look for 4H regular or hidden divergences forming near key horizontal support zones or Fibonacci retracement levels (0.618 / 0.786).
- 15-Minute Chart (15m): Execute Tactical Entry. Once the 4H divergence is spotted, drop to the 15m chart. Wait for the 15m RSI to cross upward through 30 or break a downward trendline to trigger precise order entry with a tight invalidation stop-loss.
5. Live Streaming Technical Analysis with ShiftTools
Many popular charting platforms restrict free users to 15-minute delayed data, bombard visitors with pop-up brokerage ads, or require permanent account registration.
The ShiftTools Live Crypto Chart connects directly to high-throughput exchange WebSockets (such as Binance and Coinbase Pro). Real-time tick data streams directly into your browser's local memory, calculating candlestick aggregates and rendering the 14-period RSI live on an accelerated HTML5 canvas with zero account creation and complete privacy.
6. Step-by-Step Guide: Reading Live RSI Signals on ShiftTools
-
Launch ShiftTools Live Crypto Chart
Open the ShiftTools Live Crypto Chart in any desktop or mobile web browser. The tool connects to public exchange data streams instantly.
-
Select Pair and Timeframe
Choose BTC/USDT or your preferred digital asset. Select the 1H or 4H timeframe to analyze swing momentum.
-
Enable the RSI Indicator Overlay
Toggle the RSI momentum pane beneath the primary candlestick chart. The indicator plots the 14-period Wilder line alongside horizontal reference levels at 30 (oversold), 50 (neutral median), and 70 (overbought).
-
Identify Divergence & Formulate Risk Plan
Compare the slopes of price swing pivots against the RSI peaks and valleys. Identify whether regular or hidden divergence has formed. Define your invalidation level (stop-loss) below the recent price swing low before executing any spot or derivatives trade.
Frequently Asked Questions
Ready to use the Crypto Chart?
Use our free, private browser tool right now — 100% client-side with zero server uploads.