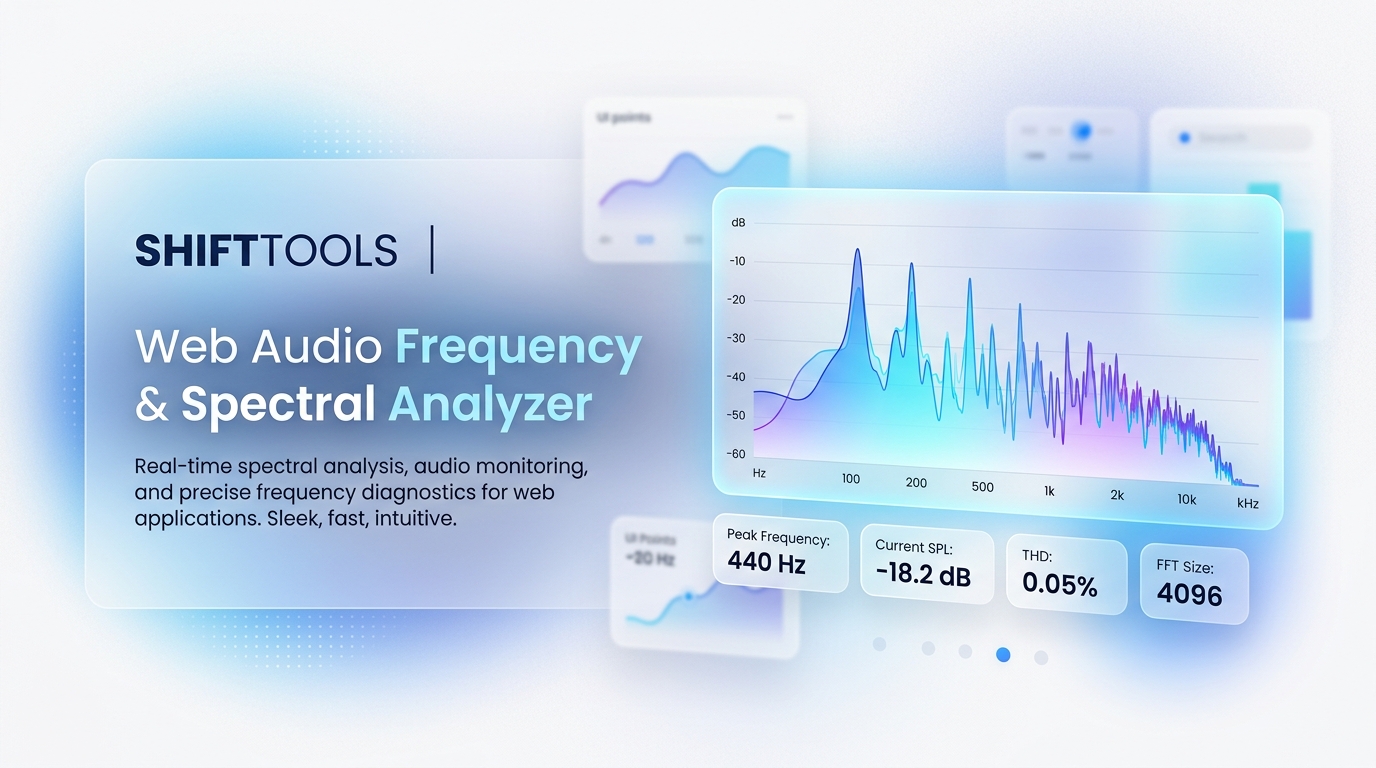
Visualizing audio frequencies in real-time is essential for music producers, podcasters, acoustic engineers, and sound designers. Whether you need to spot sub-bass mud below 60 Hz or check vocal harshness between 2 kHz and 4 kHz, a high-precision FFT Spectrum & Spectrogram Analyzer gives you complete visual clarity.
Key Features of Modern Audio Spectrum Analyzers
- Logarithmic FFT Frequency Scale: Maps frequencies from 20 Hz to 20,000 Hz according to human pitch perception.
- 2D Waterfall Spectrogram: Renders a rolling time-series heatmap of frequency intensity.
- Stereo Phase Scope (Lissajous Vector Scope): Checks mono compatibility and stereo image width.
- Fundamental Pitch ($f_0$) Detection: Identifies exact note frequencies (e.g., 440 Hz = A4).
How to Analyze Audio 100% Client-Side
ShiftTools provides a Web Audio Frequency & Spectral Analyzer that processes your audio files or live microphone feed directly inside your browser memory without cloud processing.
- Launch the ShiftTools Audio Frequency & Spectral Analyzer.
- Upload an audio file (MP3, WAV, FLAC, M4A) or enable live microphone input.
- Inspect the real-time FFT frequency curve, waterfall heatmap, and oscilloscope.
- Hover over peaks to see exact frequency (Hz), dBFS level, and musical pitch.
Analyze Your Audio Frequencies Now
100% Client-Side Web Audio API. Zero uploads, zero latency.
Launch Audio Analyzer →